2019 BOHEMIA RIVER WATER QUALITY REPORT CARD
| 2019 Bohemia River Water Quality Report Card |
Our 2019 Bohemia River Water Quality Report Card is here! During May and June, it was mailed out to all of the postal customers in our watershed and to all of our members. Over 10,000 have been distributed!
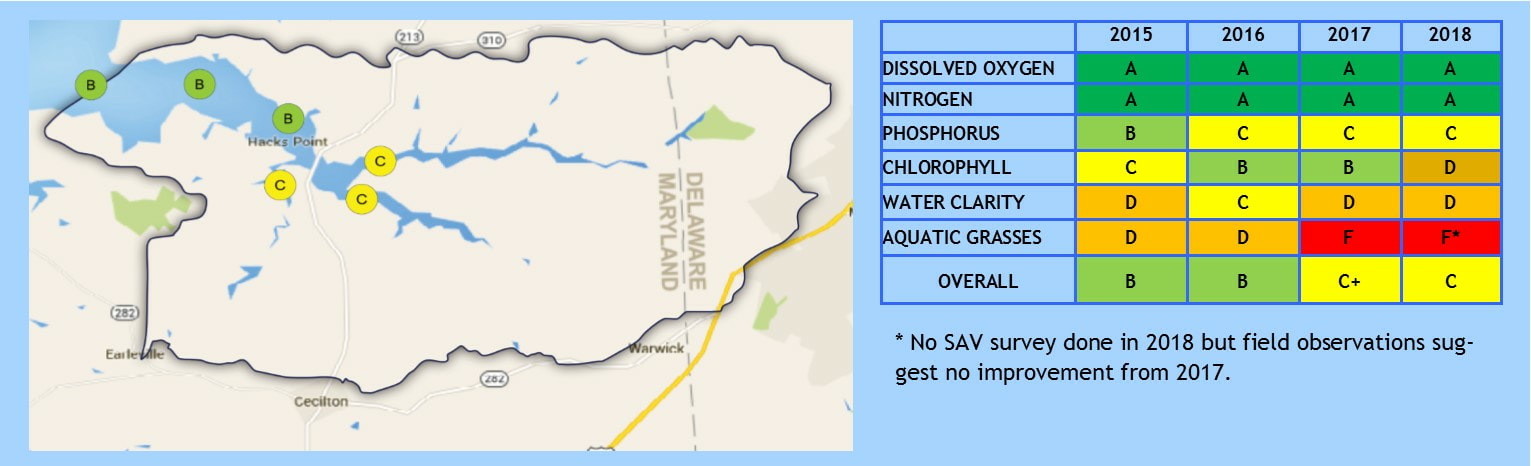
Unfortunately, the unfavorable trend over the last four years has continued, and the river's overall grade has dropped from a "B" in 2015 down to a "C" this year. Our oxygen and nitrogen scores continue to be good but lower scores for water clarity and underwater grasses are a chronic issue. This year, our chlorophyll score also deteriorated significantly, signaling the growth of potentially harmful algae. The heavy rainfall we saw in 2018 likely played a large role in this, as high rainfall brings more sediment and pollutant-laden runoff into the river. This runoff clouds the water and stimulates the growth of algae, which in-turn blocks the growth of beneficial submerged grasses.
Everybody needs clean water, and the river needs YOUR help! Download the Report Card to see concrete ideas on how to do that. Remember, the Bohemia has its headwaters in Middletown, Delaware, and what we human beings do in the upstream portion of our watershed has a large impact on the overall health of Bohemia, as well as the interconnected waterways.
The map below shows the results as grades (think school report card) at each of our six sampling sites.
OVERALL GRADES BY SITE OVERALL GRADES BY PARAMETER
2018 BOHEMIA RIVER WATER QUALITY REPORT CARD
| 2018_bohemia_river_water_quality_report_card-cropped.pdf |
This 2018 Water Quality Report Card summarizes our findings about the health of the Bohemia River, based on data collected during 2017.
2017 Bohemia River Water Quality Report Card
| 2017 Bohemia River Water Quality Report Card |
This 2017 Water Quality Report Card summarizes our findings about the health of the Bohemia River, based on data collected during 2016.
2016 Bohemia River Water Quality Report Card
| 2016 Bohemia River Water Quality Report Card |
This 2016 Water Quality Report Card summarizes our findings about the health of the Bohemia River, based on data collected during 2015.